Optiver Realized Volatility Prediction
* Optiver는 제조 회사인지 금융 회사인지 모르겠지만 어쨌든 무슨 회사 이름이다.
아래는 대략적인 개요. (더보기 누르면 보인다.)
Volatility is one of the most prominent terms you’ll hear on any trading floor – and for good reason. In financial markets, volatility captures the amount of fluctuation in prices. High volatility is associated to periods of market turbulence and to large price swings, while low volatility describes more calm and quiet markets. For trading firms like Optiver, accurately predicting volatility is essential for the trading of options, whose price is directly related to the volatility of the underlying product.
As a leading global electronic market maker, Optiver is dedicated to continuously improving financial markets, creating better access and prices for options, ETFs, cash equities, bonds and foreign currencies on numerous exchanges around the world. Optiver’s teams have spent countless hours building sophisticated models that predict volatility and continuously generate fairer options prices for end investors. However, an industry-leading pricing algorithm can never stop evolving, and there is no better place than Kaggle to help Optiver take its model to the next level.
In the first three months of this competition, you’ll build models that predict short-term volatility for hundreds of stocks across different sectors. You will have hundreds of millions of rows of highly granular financial data at your fingertips, with which you'll design your model forecasting volatility over 10-minute periods. Your models will be evaluated against real market data collected in the three-month evaluation period after training.
Through this competition, you'll gain invaluable insight into volatility and financial market structure. You'll also get a better understanding of the sort of data science problems Optiver has faced for decades. We look forward to seeing the creative approaches the Kaggle community will apply to this ever complex but exciting trading challenge.
다양한 분야의 수백 개 주식에 대해서 단기 변동성 예측하는 문제인거 같다.
이번 챌린지에 대한 평가는 RMSPE로 한다는데 그게 뭔진 몰라도 아래와 같은 식으로 평가한다고 한다.
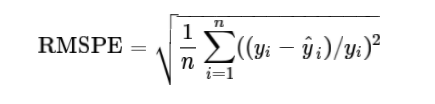
대충 실제값(y)과 예측값(y^)의 차이를 실제값(y)으로 나누고 그걸 제곱해서 다 더한 뒤 다시 총 개수(n)만큼으로 나눠주는 식인가보다.
데이터에 대한 소개. (더보기 누르면 보인다.)
This dataset contains stock market data relevant to the practical execution of trades in the financial markets. In particular, it includes order book snapshots and executed trades. With one second resolution, it provides a uniquely fine grained look at the micro-structure of modern financial markets.
This is a code competition where only the first few rows of the test set are available for download. The rows that are visible are intended to illustrate the hidden test set format and folder structure. The remainder will only be available to your notebook when it is submitted. The hidden test set contains data that can be used to construct features to predict roughly 150,000 target values. Loading the entire dataset will take slightly more than 3 GB of memory, by our estimation.
This is also a forecasting competition, where the final private leaderboard will be determined using data gathered after the training period closes, which means that the public and private leaderboards will have zero overlap. During the active training stage of the competition a large fraction of the test data will be filler, intended only to ensure the hidden dataset has approximately the same size as the actual test data. The filler data will be removed entirely during the forecasting phase of the competition and replaced with real market data.
데이터 용량이 3Gb다;; 뭐가 많은가보다.
아래는 자세한 개별 데이터 파일에 대한 정보.
대충 어떤 항목들과 자료들이 들어있는지 볼 수 있다.
book_[train/test].parquet A parquet file partitioned by stock_id. Provides order book data on the most competitive buy and sell orders entered into the market. The top two levels of the book are shared. The first level of the book will be more competitive in price terms, it will then receive execution priority over the second level.
- stock_id - ID code for the stock. Not all stock IDs exist in every time bucket. Parquet coerces this column to the categorical data type when loaded; you may wish to convert it to int8.
- time_id - ID code for the time bucket. Time IDs are not necessarily sequential but are consistent across all stocks.
- seconds_in_bucket - Number of seconds from the start of the bucket, always starting from 0.
- bid_price[1/2] - Normalized prices of the most/second most competitive buy level.
- ask_price[1/2] - Normalized prices of the most/second most competitive sell level.
- bid_size[1/2] - The number of shares on the most/second most competitive buy level.
- ask_size[1/2] - The number of shares on the most/second most competitive sell level.
trade_[train/test].parquet A parquet file partitioned by stock_id. Contains data on trades that actually executed. Usually, in the market, there are more passive buy/sell intention updates (book updates) than actual trades, therefore one may expect this file to be more sparse than the order book.
- stock_id - Same as above.
- time_id - Same as above.
- seconds_in_bucket - Same as above. Note that since trade and book data are taken from the same time window and trade data is more sparse in general, this field is not necessarily starting from 0.
- price - The average price of executed transactions happening in one second. Prices have been normalized and the average has been weighted by the number of shares traded in each transaction.
- size - The sum number of shares traded.
- order_count - The number of unique trade orders taking place.
train.csv The ground truth values for the training set.
- stock_id - Same as above, but since this is a csv the column will load as an integer instead of categorical.
- time_id - Same as above.
- target - The realized volatility computed over the 10 minute window following the feature data under the same stock/time_id. There is no overlap between feature and target data. You can find more info in our tutorial notebook.
test.csv Provides the mapping between the other data files and the submission file. As with other test files, most of the data is only available to your notebook upon submission with just the first few rows available for download.
- stock_id - Same as above.
- time_id - Same as above.
- row_id - Unique identifier for the submission row. There is one row for each existing time ID/stock ID pair. Each time window is not necessarily containing every individual stock.
sample_submission.csv - A sample submission file in the correct format.
- row_id - Same as in test.csv.
- target - Same definition as in train.csv. The benchmark is using the median target value from train.csv.
뭐 이런 파일들이 있다고 한다.
parquet 파일을 처음 봤다. 파케이라고 읽나보다.
읽고 쓸려면 pyarrow를 먼저 인스톨 해줘야한다. (pip나 conda 인스톨 모두 가능한 듯.)
Reading and Writing the Apache Parquet Format — Apache Arrow v5.0.0
Reading and Writing the Apache Parquet Format — Apache Arrow v5.0.0
This creates a single Parquet file. In practice, a Parquet dataset may consist of many files in many directories. We can read a single file back with read_table: You can pass a subset of columns to read, which can be much faster than reading the whole file
arrow.apache.org
자세한 건 공식사이트 참고하는게 빠를 듯.
결국 내야하는 건 row_id에 맞게 예측한 값을 담은 submission파일.
오늘은 여기 까지만 보고 다음번에 더 보는걸로.
'AI' 카테고리의 다른 글
| 1208 - 서포트백터머신 (0) | 2021.12.08 |
|---|---|
| 1207 - 로지스틱회귀 (0) | 2021.12.07 |
| 1207 - 아달린 SGD (0) | 2021.12.07 |
| 1202 - 아달린 (0) | 2021.12.02 |
| 1201 - 퍼셉트론 (0) | 2021.12.01 |


